Chart reading is a very important skill in stock market investing. This is the part 2 of the guest post of my investment mentor, Mr. Ricky So.
See the first part of this post here:
Chart Reading or Technical Analysis: An important Skill in Stock Market Investing (Part 1)
Mr. Ricky So. Mr. So has more than 25 years of experience in the financial services industry. He is an Independent Financial Adviser and currently, the Chief Knowledge Officer for Investment Planning of Wealth Management Center for Communications and Research, Inc. Prior to this, he held senior management positions in various investment and commodities firms, the last of which was as Head of Training of one of the Philippine’s top asset management companies and was once a portfolio manager.
Chart Reading or Technical Analysis: An important Skill in Stock Market Investing (Part 2)
By Ricky G. So, CIS, RFP, CIPP
The next item for consideration is the moving averages. These are known as trend following indicators as it is plotted along the price action. Moving averages are calculated depending on the parameter used. By parameter, we mean the number of data used to compute the indicator. The popular parameter for moving averages is 20 – 50 – 100 – 200 units. The units refer to the unit of data being computed. Say if the chart used is a daily one, then the indicator uses 20-50-100-200 days. Sometimes these units of time can be in hourly, weekly or monthly. A 100 day moving averages means the average price over the past 100 days: computed and plotted daily. An example of moving averages is one below. This particular moving averages is a simple one. Thus, it is called simple moving averages. The other two types are exponential and weighted moving averages. They all work similarly.
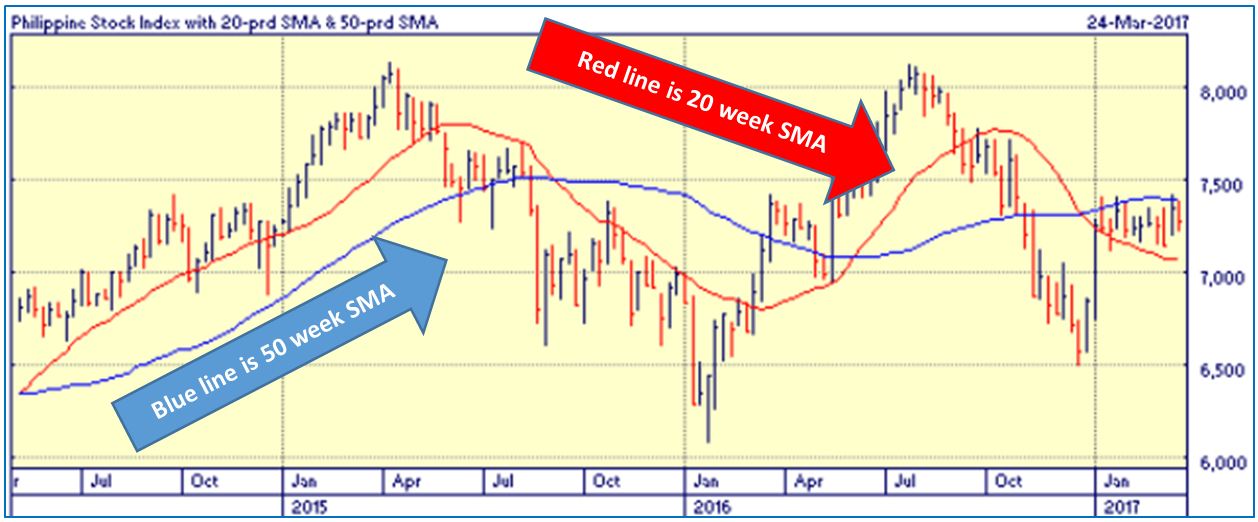
From the illustration, generally, the moving averages move either above the price or below it. From the left side or about the latter half of 2014, the moving averages were both moving below the price. This means the market is bullish or in upward bias. By May 2015, after hitting a high above the 8,000 points, the price started moving lower and has gone down below the moving averages. By this time, the market has turned bearish or in downward bias. The uptrend did not manifest until about March 2016 when price moved above the moving averages. This lasted to about July – August of 2016 which afterwards moved below the moving averages again.
At present, the price is in between the moving averages and has so far cleared only the red line or the 20 week moving averages. The blue averages or the 50 week provides a ‘resistance’ at about 7,400 points which is congruent or consistent with the horizontal resistance previously discussed. And that the red averages, seems to be providing a ‘support’ to the price action.
In this regard, moving averages are good guides in determining trends either upward or downward. Traders, investors and advisers alike are able to discern a rising or falling market and make decisions accordingly.
The third tool that we will showcase is the Relative Strength Index or RSI. This is a mathematically calculated indicator which takes into account the closing prices of the index or the stock. Technically, this is called an oscillator as it moves between 0% and 100% and plotted independent of the price chart but in line with it. The RSI simply signals whether the market is overbought or oversold. When the market is considered overbought, the expectation is that it is the end of the rise and may already come down for either a correction or reversal due to profit taking. Conversely, an oversold market means that the sellers had been dominant and that it is nearing end of the slide. Thus, the expectation is that the price will start rising. In the price chart below, which is the weekly chart of the PSE index, the RSI clearly has moved in accordance to expectation that moment it reached the overbought and oversold areas.
RSI usually considers the market or a stock overbought when the oscillator has reached 70%. In the chart below, the overbought signal showed up when the index has hit more than 8,000 points. After hitting this mark, the market turned lower which is the expected price action. Conversely, there were occasions of the market being oversold and that it is sign of a bottom or a weak price action. Subsequently, the ensuing price action was a rise. This indicator is not perfect though like the others. Because at times the market continue to go up even as it hits the overbought zone. The same is true when hitting the bottom. And at present, the RSI lies I the middle of the range implying a neutral sentiment in the market.
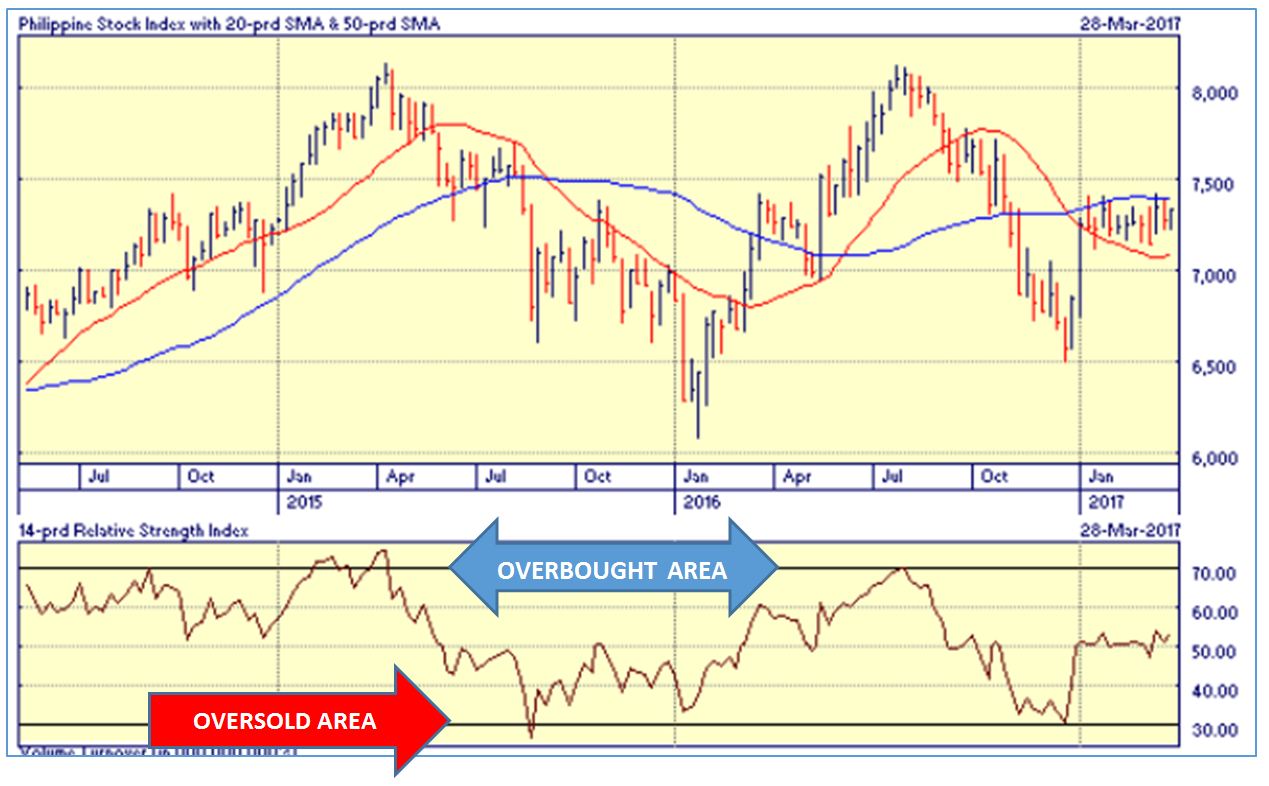
So like the other tools in analyzing the market, this RSI will help the trader, investor or the advisor to see and feel the actual sentiment of the market for stocks which aims to aid the decision making process.
Technical analysis may not have 100% accuracy and will never will. But the probability of being right on some points can be thrilling and profitable. It is better to decide on trades and investment decisions with a tool or basis rather than nothing. And similarly, advisory to clients will be with basis and when dispensed properly, it is profitable for both parties. Perhaps the advisor with this kind of capability is most likely will be well sought by clients.
Want to know more? You can visit Mr. Ricky So in The Fast Exchange.
You can join his Technical Analysis Camp, Click Here.
For your Financial Health,

Read More:
- Chart Reading or Technical Analysis (Part 1)
- How to compute Company Retirement Benefit
- How to Continue Generating Income Even after You’re Gone
- Buying your First Home: Pag-IBIG vs Commercial Banks Housing Loan Rates
Latest posts by Pinky De Leon-Intal, MD, RFC (see all)
- Say Goodbye to Chronic Lifestyle Diseases (Hypertension, Diabetes, Cancer, Gout, etc.) with Right Food and Right Water - 23 May, 2023
- Embracing Superpowers: A Mom’s Journey as a Doctor, Professor, and Financial Consultant - 19 May, 2023
- Celebrating the Power of Women: Honored by Philippine Daily Inquirer - 17 May, 2023