In the world of health and medicine, in the different specialties and sub-specialties, it is always good to look for consultants and mentors who can teach me the ways to do the things right. Same in wealth advisory industry, especially in stock market investing, it is very important to have mentors as well. I am very fortunate to have the best mentors in the country today.
If you are in the wealth creation through stock market, this mentor of mine has an unparalleled experience. Let me introduce to you to: Mr. Ricky So. Mr. So has more than 25 years of experience in the financial services industry. He is an Independent Financial Adviser and currently, the Chief Knowledge Officer for Investment Planning of Wealth Management Center for Communications and Research, Inc. Prior to this, he held senior management positions in various investment and commodities firms, the last of which was as Head of Training of one of the Philippine’s top asset management companies and was once a portfolio manager.
I am fortunate to have him to guest in this post discussing an important skill each stock market investor should posses. This is a 2-part-series that will teach you how to have that Technical Analysis Skill.
The following will be his guest post.
Chart Reading or Technical Analysis: An Important Advisory Skill (Part 1)
By Ricky G. So, CIS, RFP, CIPP
As of this writing, I am currently conducting stock investing to top notch financial advisors of a leading insurance company in the land. And as we get into the point of studying technical analysis, or chart reading, they are in awe and are excited to engage themselves into trading and investing stocks. It seems that the new found learning – while still on its early stage – seems enticing enough to risk some of their money and try it.
I told them also, that indeed to uplift your advisory skills, skills are what you need. Technical analysis is a skill that can be developed that can benefit the advisor – personally and professionally. It is timely these days that investing consciousness is getting prevalent coupled with technology that can make things easy. This kind of learning is likewise easy to come by.
Some may ask, what is in it for me? Well, I say what would you feel if you have sensed the top of the market in April of 2015 at 8,136 points? Could you have advised differently then? Or, would have sensed that the bottom is near in January of 2016 when the stock index or PSEi hit a low of 6,082 and then the next bottom in December 2016 at 6,500 points? While these are historical data, and one might say hindsight is a 20-20 vision; there are witness and evidences to account all of these. But I don’t say technical analysis is fool proof. I say it is a useful tool in making sound advice and make profit from one’s hard earned money by investing it wisely and with guidance.
How does one read chart anyway? How can we pin point a top or a bottom?
Well, here are some basic principles of technical analysis (TA). First there are “areas” where in we expect buyers and sellers will be present. By knowing these areas, we are guided to act accordingly. In TA we call these areas ‘supports’ and ‘resistances’. Support is a price level by which buyers are expected to come into the market. On the other hand, resistance is a price level by which sellers are expected to come into the market. There are essentially three types of supports and resistances. These are horizontal, angular and psychological. In the chart below which is the PSEi Weekly the resistances are horizontal where a top is extended to determine the next potential top. This is the one above 8,000 points. Whereas an angular one connects two tops to determine the extended resistance line.
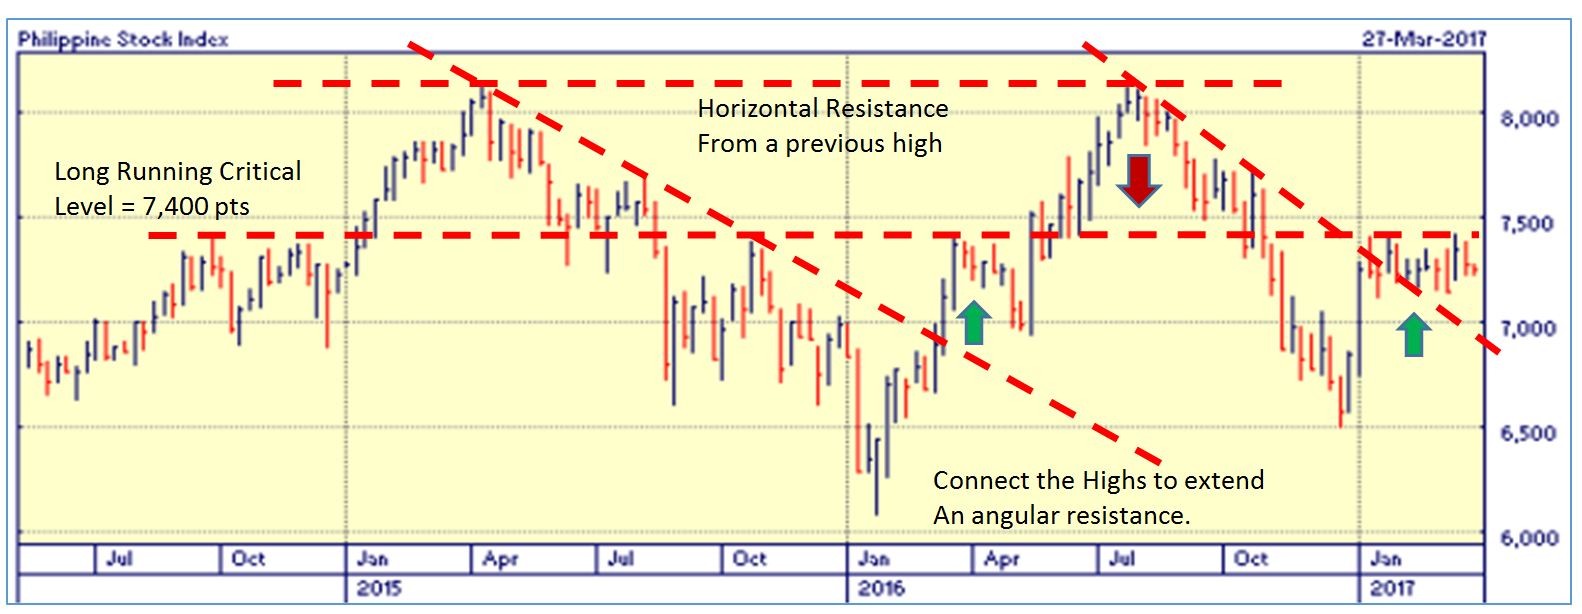
From the illustration which is the current situation, there is a long running resistance line at 7,400 which originated from 2014 and still working up until today.
What is the relevance of these resistances? A horizontal resistance is an expected top when achieved in the future – two things can happen. Hitting resistance will either hold up or the price break out of it and move upwards. Breaking it upwards will commence a rise, generally. Similarly, the descending angular resistance is determined by connecting at least two highs which will determine the subsequent tops. Two things can happen, either the resistance will hold which will continue the slide or the break of it… that will ensue a rise. This is what happened in about March of 2016 and January of 2017. Therefore, since the chart above is the current one, the sentiment is upwards because the descending angular resistance is broken and the price continue to move above this level. However, the horizontal resistance at 7,400 remains a hurdle for now. This is what is being watched by many traders.
On the other hand, the opposite of the resistance is support. Similarly, it is determined by connecting the lows of the price action then extended to determine the next support levels. It could also be connecting two lows in the past to extend into a horizontal support. The relevance of the support level is to provide an entry point from which a potential cut-loss can also be placed whenever the price breaks down under the support.
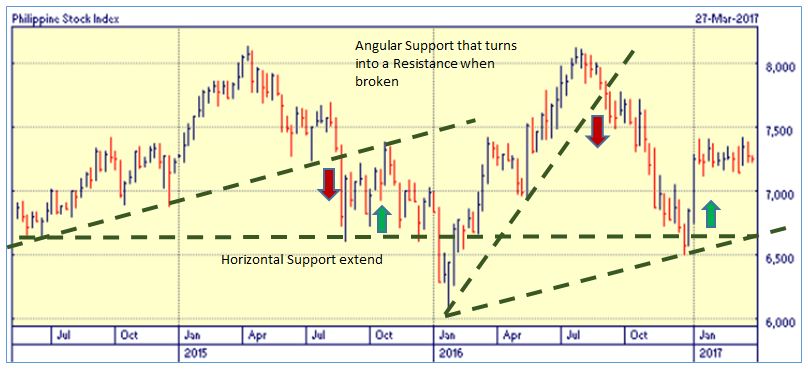
Without these lines to determine supports and resistances, it will be very difficult to determine entry and exit points. To summarize, an entry point could be the price nearing support or a price above the resistance after a successful break out. Subsequently, when a trade is entered on the basis of the support, a stop loss can be initiated when the price reverts below the support line especially on a closing price of a session. In this case, the price may continue to trek lower. Conversely, a break out of the resistance can be a buy entry point. And the return below the resistance can be perceived as a continuation of the downward movement.
All told, identifying supports and resistances can help a trader or an investor plan a trade. The quantifiable characteristic of technical analysis greatly aids trader’s or investor’s decision making process. If one will follow this, possibly, less mistakes can happen. This concept can also guide financial advisors in advising clients as to their outlook of the market. Supposedly, the outlook will somehow correspond to the actual market performance and analysis.
To be continued…
Want to know more? You can visit Mr. Ricky So in The Fast Exchange.
You can join his Technical Analysis Camp, Click Here.
Helping you learn more,

Read More:
- Stock Investing 101: The Simplest Guide Part 1
- The Best INVESTMENT Vehicle for your Child’s Education
- The Secrets of the Millionaire Mind – Part 1
- The Secrets of the Millionaire Mind – Part 2
Latest posts by Pinky De Leon-Intal, MD, RFC (see all)
- Say Goodbye to Chronic Lifestyle Diseases (Hypertension, Diabetes, Cancer, Gout, etc.) with Right Food and Right Water - 23 May, 2023
- Embracing Superpowers: A Mom’s Journey as a Doctor, Professor, and Financial Consultant - 19 May, 2023
- Celebrating the Power of Women: Honored by Philippine Daily Inquirer - 17 May, 2023